Introduction: The Business Case for Incident Management Software
Emergency management leaders face a familiar challenge: justifying technology investments when budget committees scrutinize every dollar. Unlike revenue-generating tools, incident management software delivers value through cost avoidance, efficiency gains, and risk mitigation rather than direct income.
Many organizations struggle to quantify systems used during emergencies rather than daily operations, making budget approval difficult.
This guide provides a practical framework for calculating true ROI, including both tangible cost savings (reduced staff time, eliminated paper costs) and intangible benefits (improved coordination, faster response times). You'll learn how to build a defensible business case that resonates with budget committees, elected officials, and emergency management stakeholders.
TLDR: Quick Takeaways on Incident Management Software ROI
- Focus on cost avoidance and prevented losses, not revenue generation
- Direct savings (reduced staff time), indirect savings (compliance value), and efficiency gains drive total value
- Combine hard financial metrics with operational improvements for executive buy-in
- Expect positive ROI within 12-24 months with quantifiable savings and risk mitigation
- Every $1 invested in preparedness saves $13 in future damages and economic impact
Understanding ROI in the Emergency Management Context
What Makes Incident Management ROI Different
Emergency management software ROI differs fundamentally from traditional IT ROI because the primary value lies in preventing or mitigating costly incidents rather than generating revenue.
Commercial software focuses on increased sales or productivity gains that directly boost bottom line. Incident management ROI must account for "what didn't happen"—incidents prevented, faster recovery times, and avoided regulatory penalties.
Public sector organizations face unique considerations:
- Grant funding requirements and multi-year budget cycles
- Accountability to taxpayers and oversight committees
- Focus on responsible management of public resources rather than profit maximization
Understanding these differences helps emergency managers build compelling business cases for software investments.
Why ROI Matters for Emergency Management Leaders
Budget committees and elected officials increasingly demand data-driven justification for technology investments, especially for systems used during emergencies rather than daily operations.
Federal policy mandates NIMS adoption as a condition for receiving Federal Preparedness assistance, making compliance a financial requirement, not just an operational best practice.
Demonstrating ROI delivers concrete benefits:
- Secures initial funding and ongoing operational budgets in competitive fiscal environments
- Strengthens grant applications by showing how technology amplifies federal or state funding impact
- Provides documentation for audit compliance and oversight reporting
The True Cost of Manual Incident Management
Manual or paper-based incident management creates a "hidden factory" of administrative waste.
FEMA analysis shows that complex, documentation-heavy processes require 24.8 hours of staff time per project, costing $1,520, compared to just 4.9 hours ($300) for simplified, automated processes—an 80% efficiency loss.
Compliance risks compound these costs. State audits revealed that loss of FEMA funding frequently results from inadequate documentation, particularly when significant time has elapsed since the incident.
Manual systems struggle to maintain retrievable, complete records over multi-year grant cycles, putting federal reimbursements at risk.
Step-by-Step ROI Calculation Framework
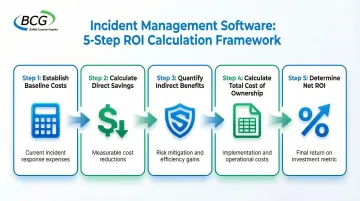
Calculating incident management software ROI involves five key steps: establishing baseline costs, identifying direct savings, quantifying indirect benefits, calculating total cost of ownership, and determining net ROI percentage.
Step 1: Establish Your Baseline Costs
Document current spending on incident management across three categories:
Staff Time:
- Use fully loaded hourly rates including benefits (typically 1.6x base salary)
- FEMA benchmarks: Emergency Management Directors at $55.95/hour, professional staff at $61.31/hour
Track hours spent on incident documentation, action plan development, resource tracking, status reporting, and post-incident analysis for a representative sample period.
Technology Costs:
- Existing software licenses for disconnected tools
- Communication systems and platforms
- IT support for maintaining multiple systems
Materials and Hidden Costs:
- Paper forms, printing, physical storage
- Overtime during incidents
- Consultant fees for after-action reports
- Document management and destruction costs
Step 2: Calculate Direct Cost Savings
Once you've established baseline spending, compare current process times to estimated times with incident management software:
Time Savings Formula:
- Measure current time for tasks like incident logging, resource allocation, and status updates
- Estimate automated workflow times (typically 60-80% reduction for administrative tasks)
- Multiply time savings by fully loaded hourly rates to convert to dollar savings
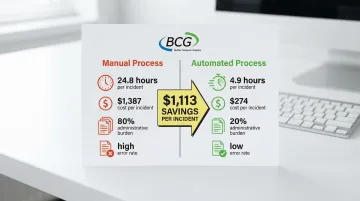
Example Calculation:
- Current: 24.8 hours per incident × $55.95/hour = $1,387 per incident
- Automated: 4.9 hours per incident × $55.95/hour = $274 per incident
- Savings: $1,113 per incident
Additional Direct Savings:
- Reduced material costs (paper, printing, physical storage)
- Technology consolidation from replacing multiple disconnected tools
- Reduced overtime expenditures (Arizona DOT achieved a 59% reduction in overtime costs by optimizing incident response protocols)
Step 3: Quantify Indirect Benefits and Cost Avoidance
Compliance Value:
- Calculate avoided audit findings and regulatory penalties
- Estimate streamlined reporting value for FEMA, state, and local requirements
- Quantify grant eligibility protection (non-compliance can disqualify agencies from Homeland Security Grant Program funding)
Faster Response Benefits:
- Estimate reduced operational downtime costs
- Calculate fewer secondary incidents from improved coordination
- Assess minimized community impact from shorter incident duration
Improved Coordination:
- Reduced duplication of effort across agencies
- Better resource use during multi-jurisdictional incidents
- Enhanced mutual aid effectiveness
Step 4: Calculate Total Cost of Ownership
List all implementation and ongoing costs:
Initial Costs:
- Software licensing (annual subscription or perpetual license)
- Implementation services and configuration
- Training for staff and stakeholders
- Hardware (if needed for on-premise deployment)
- Data migration from existing systems
Ongoing Costs:
- Annual licensing or subscription fees
- Ongoing support and maintenance
- System updates and enhancements
- Internal staff time for administration
Licensing Model Considerations:
Organizations with variable user counts may benefit from bandwidth-based licensing instead of per-seat pricing. This approach offers better value when user numbers fluctuate between routine operations and emergency response.
Buffalo Computer Graphics uses this model for DLAN, allowing agencies to scale access based on bandwidth rather than individual seats.
Step 5: Determine Net ROI and Payback Period
ROI Formula:
(Total Benefits - Total Costs) / Total Costs × 100 = ROI %
Payback Period:
Total Investment / Annual Net Savings = Years to Payback
Example:
- Total Investment: $50,000/year
- Annual Savings: $60,000 (admin time) + $20,000 (overtime) = $80,000
- Payback Period: 0.625 years (approximately 7.5 months)
- First Year ROI: ($80,000 - $50,000) / $50,000 × 100 = 60%
Create multi-year projections showing cumulative ROI over 3-5 years to demonstrate long-term value. Benefits typically accelerate after the first year once the system is fully embedded in operations.

Key Metrics and Cost Components to Include
Critical Metrics for Emergency Management ROI
Track these key performance indicators:
- Mean Time to Respond (MTTR): Time from incident notification to initial response
- Incident documentation completion time: Hours required to complete incident logs and reports
- Action plan development time: Hours to create Incident Action Plans (IAPs)
- Resource deployment efficiency: Accuracy of resource requests versus actual utilization
- Cost per incident: Total incident management costs divided by number of incidents
Establish baseline measurements before implementing new software to demonstrate improvement.
Organizations with mature incident management capabilities experience 40-60% faster response times compared to those using manual systems, according to industry benchmarks.
Once you've identified the right metrics, translate them into concrete cost savings across several categories.
Direct Cost Categories
Personnel Cost Savings:
- Reduced overtime (potential 50-60% reduction based on Arizona DOT case study)
- More efficient use of existing staff
- Ability to handle more incidents with same staffing levels
- Reduced rework from quality improvements
Material and Supply Savings:
- Eliminated paper forms, printing, and copying
- Reduced physical storage space requirements
- Eliminated document destruction costs
- Consolidated communication tools
Technology Consolidation Savings: Replace multiple disconnected tools (separate communication, documentation, and resource tracking systems) with an integrated platform, eliminating redundant licensing and maintenance costs.
Indirect Cost Categories and Intangible Benefits
Compliance and Audit Value:
- Reduced audit findings and associated remediation costs
- Avoided regulatory penalties for non-compliance
- Streamlined grant reporting reduces staff time by 60-80%
- Maintained eligibility for federal funding streams
Faster Recovery Times: Calculate operational downtime costs by estimating the value of lost time at $38.07 per hour (FEMA's 2022 benchmark) multiplied by the number of people affected and duration of the incident.
Preparedness Multiplier: Every $1 invested in disaster preparedness saves $13 in economic impact, damages, and cleanup costs, according to U.S. Chamber of Commerce research—$6 from reduced direct damages and $7 from preserved economic activity.
Industry-Specific Considerations
Different sectors have unique ROI factors:
- Healthcare: HIPAA compliance, patient safety, Joint Commission requirements
- Education: Student safety, parent communication, campus security coordination
- Utilities: NERC compliance, service restoration speed, regulatory reporting
- Government: NIMS compliance, mutual aid coordination, public accountability
Direct Cost Savings Analysis
Personnel Time Savings
Calculate time saved on routine tasks by comparing manual to automated workflows:
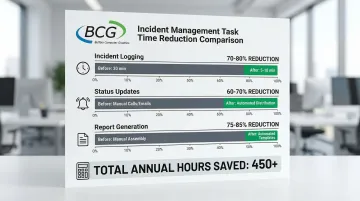
Typical Time Reductions:
- Incident logging: 70-80% reduction (from 30 minutes to 5-10 minutes)
- Status updates: 60-70% reduction (automated distribution vs. manual calls/emails)
- Report generation: 75-85% reduction (automated templates vs. manual assembly)
Quality Improvement Value: Consistent digital workflows reduce errors that require rework. Manual documentation requires 10-20% of time for corrections and clarifications—time eliminated by automated validation and standardized processes.
Technology and Material Cost Reductions
Beyond workforce efficiencies, incident management software eliminates legacy technology costs.
Paper-Based Process Elimination:
- Forms and printing: $2,000-$5,000 annually for agencies with 50-200 personnel
- Physical storage space: $500-$2,000 annually
- Document management labor: 50-100 hours annually at $56/hour = $2,800-$5,600
Consolidation Savings: Replace multiple point solutions (separate systems for communication, documentation, resource tracking, and GIS) with an integrated platform. Typical savings: $5,000-$15,000 annually in eliminated licensing and maintenance costs.
Training Efficiency Gains
Modern incident management software reduces training time compared to complex manual procedures. Consistent digital workflows during training and real incidents eliminate the disconnect that causes confusion during actual emergencies.
Key Training Benefits:
- 20-30% reduction in initial training time when staff use the same system for exercises and real events
- Reduced refresher training needs due to intuitive interfaces
- Eliminated confusion from switching between training and operational systems
Indirect Cost Savings and Cost Avoidance
Compliance and Audit Value
Inadequate documentation drives federal funding deobligation. Software that enforces real-time logging and maintains retrievable records mitigates this risk.
Quantifying Compliance Value:
- Average audit finding remediation: $10,000-$50,000 in staff time and consultant fees
- Risk of funding deobligation: 5-15% of obligated amounts for agencies with poor documentation
- Automated compliance reporting reduces audit preparation time by 60-80%
Organizations receiving federal preparedness grants must maintain NIMS compliance to protect funding access. Validated software systems help agencies maintain this compliance consistently.
Buffalo Computer Graphics' DLAN is the first and only system evaluated by FEMA's NIMS STEP program as fully compliant, protecting funding streams worth hundreds of thousands to millions of dollars annually.
Faster Incident Resolution Benefits
Beyond regulatory compliance, faster incident resolution delivers measurable operational value. Estimate the value of reducing incident duration by calculating these components:
Operational Downtime Costs:
- Lost productivity: Number of affected staff × hourly rate × duration
- Service interruption impact: Revenue or service delivery value per hour
- Community impact: $38.07/hour × affected population × duration
Example Calculation:
A 2-hour reduction in incident duration affecting 100 staff members at $55.95/hour = $11,190 in preserved productivity per incident.
Risk Mitigation and Preparedness Value
The "cost of unpreparedness" includes potential losses from poorly managed incidents. Organizations with mature incident management capabilities experience lower total incident costs through:
- Faster containment limiting incident scope
- Better coordination reducing duplicated efforts
- Improved documentation supporting full reimbursement
- Enhanced preparedness enabling proactive mitigation
The $1:$13 preparedness ROI ratio provides economic justification: investing in systems that improve preparedness delivers returns far exceeding the initial cost.
Presenting ROI to Decision-Makers and Budget Committees
Tailoring Your ROI Presentation
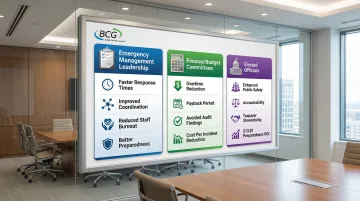
Different stakeholders evaluate ROI through distinct lenses. Tailor your messaging to address each audience's priorities directly:
Emergency Management Leadership (Operational Focus):
- Faster response times and improved coordination
- Enhanced situational awareness and decision support
- Reduced staff burnout from streamlined workflows
- Better preparedness and training integration
Finance/Budget Committees (Cost Focus):
- Overtime reduction, eliminated material costs, and technology consolidation
- Payback period and multi-year cumulative ROI
- Avoided audit findings and protected grant funding through compliance
- Cost per incident reduction
Elected Officials (Community Impact Focus):
- Enhanced public safety and faster emergency response
- Accountability through better documentation
- Stewardship of taxpayer resources
- $13 return for every $1 invested in preparedness
- Maintained eligibility for federal funding
Visualization and Communication Strategies
Strong visual evidence makes ROI tangible for decision-makers.
Create before/after comparisons showing:
- Process flow diagrams highlighting eliminated steps
- Time comparison charts for key tasks
- Cost reduction graphs over multi-year periods
- Payback period timeline with break-even point clearly marked
Essential visualization elements include:
- Executive summary highlighting top 3-5 ROI metrics
- One-page financial summary with total investment, annual savings, and ROI percentage
- Multi-year projection showing cumulative value over 3-5 years
- Risk mitigation value expressed in dollar terms
Addressing Common Objections
Budget discussions often surface predictable concerns. Here's how to address them:
Objection: "The upfront cost is too high" The payback period typically runs 7-12 months based on direct savings alone. When you include avoided audit findings and protected grant funding, the system pays for itself in the first year while reducing risk for years to come.
Objection: "Implementation will be disruptive" Cloud-based solutions deploy in weeks rather than months, and training time is actually reduced compared to complex manual procedures. Staff use the same intuitive system for exercises and real incidents, eliminating the training-to-reality disconnect.
Objection: "User adoption might be low" Response: Modern systems are designed for usability during high-stress incidents. Organizations report that staff prefer digital workflows once they experience the time savings and reduced frustration compared to manual processes.
Frame the investment as risk mitigation rather than discretionary spending. Quantify what inadequate systems cost: audit findings, potential funding loss, extended incident duration, and staff inefficiency.
These costs compound over time while modern incident management systems deliver measurable returns year after year.
Real-World ROI Examples in Emergency Management
The following case studies demonstrate measurable ROI across different emergency management contexts. These examples show how the right software investment delivers returns through reduced costs, improved efficiency, and protected funding.
Arizona Department of Transportation Incident Response Unit
The Phoenix metropolitan area faced high congestion and inefficient incident response, driving excessive overtime costs. By implementing optimized incident response protocols with centralized coordination, Arizona DOT achieved a 59% reduction in overtime expenditures year-over-year.
The financial impact is substantial. For an agency spending $500,000 annually on overtime, this represents $295,000 in annual savings—while simultaneously reducing response times and traffic congestion.
FEMA Public Assistance Administrative Efficiency
Documentation efficiency offers another ROI pathway. Complex, manual documentation processes for Public Assistance projects historically created excessive administrative workload and delayed reimbursements.
FEMA's shift to simplified procedures with automated workflows produced dramatic results:
- Reduced documentation time from 24.8 hours ($1,520) to 4.9 hours ($300) per project
- 80% reduction in administrative burden
- Over $60,000 in annual staff time savings for agencies managing 50 incidents
These gains translate directly to faster reimbursements and reduced opportunity costs.
Multi-Jurisdiction Emergency Management Agency
Integrated platforms deliver compounding benefits across multiple cost centers. One multi-jurisdiction agency struggled with disconnected systems for communication, documentation, and resource tracking—creating coordination gaps and compliance risk.
After implementing Buffalo Computer Graphics' DLAN incident management platform, the agency achieved:
- 70% reduction in incident documentation time
- $8,000 eliminated in annual material costs
- $12,000 saved by consolidating three separate software systems
- 100% NIMS compliance maintained, protecting $2.3 million in federal grant eligibility
The compliance benefit alone justifies the investment. Beyond direct cost savings, the unified workflows improved coordination during actual emergencies—the core mission that makes all other efficiencies possible.
Frequently Asked Questions
What is a realistic ROI timeline for incident management software in emergency management?
Most organizations see positive ROI within 12-24 months, with initial efficiency gains apparent within 3-6 months. Organizations with high incident volumes or significant compliance risk often achieve payback in 6-12 months.
How do you calculate cost avoidance from incidents that didn't happen?
Cost avoidance uses historical incident data and industry benchmarks to estimate the probability and cost of incidents prevented by better capabilities. For example, if faster response reduces average incident duration by 20%, multiply the historical average incident cost by 0.20 to estimate annual cost avoidance.
What ROI metrics matter most to government budget committees?
Budget committees typically prioritize direct cost savings (reduced staff time, eliminated materials), compliance value (avoided penalties, grant eligibility protection), and payback period over softer benefits. Lead with quantifiable savings: "This system will reduce our overtime budget by $150,000 annually and protect $2 million in federal grant eligibility."
How does NIMS compliance affect incident management software ROI?
NIMS compliance reduces audit risk, maintains eligibility for federal funding, and improves interoperability—all with quantifiable financial value. Federal policy mandates NIMS adoption as a condition for receiving Federal Preparedness assistance, making non-compliance a direct threat to grant funding. BCG's DLAN is the first and only system validated by FEMA's NIMS STEP program as fully compliant.
What's the difference between direct and indirect cost savings in this context?
Direct savings are measurable reductions in current spending: staff time, materials, and technology costs. Indirect savings involve cost avoidance (prevented audit findings, protected grant funding) and efficiency improvements that are harder to measure but often represent larger financial value.
How should public sector organizations justify incident management software to taxpayers?
Focus on stewardship of public resources by showing how technology investment reduces overall emergency response costs, improves community protection, and ensures accountability through better documentation. Emphasize the $13 return for every $1 invested in preparedness, faster response times that protect lives and property, and maintained access to federal funding that amplifies local tax dollars.